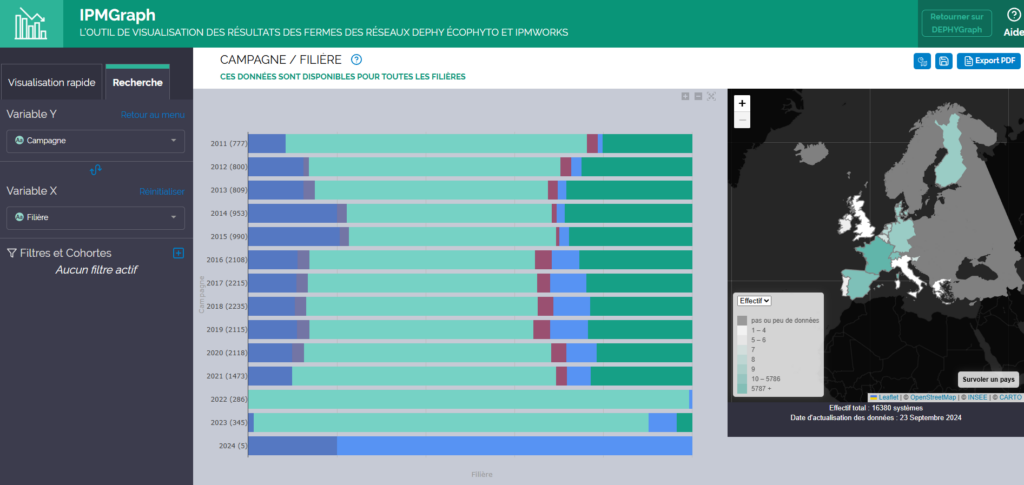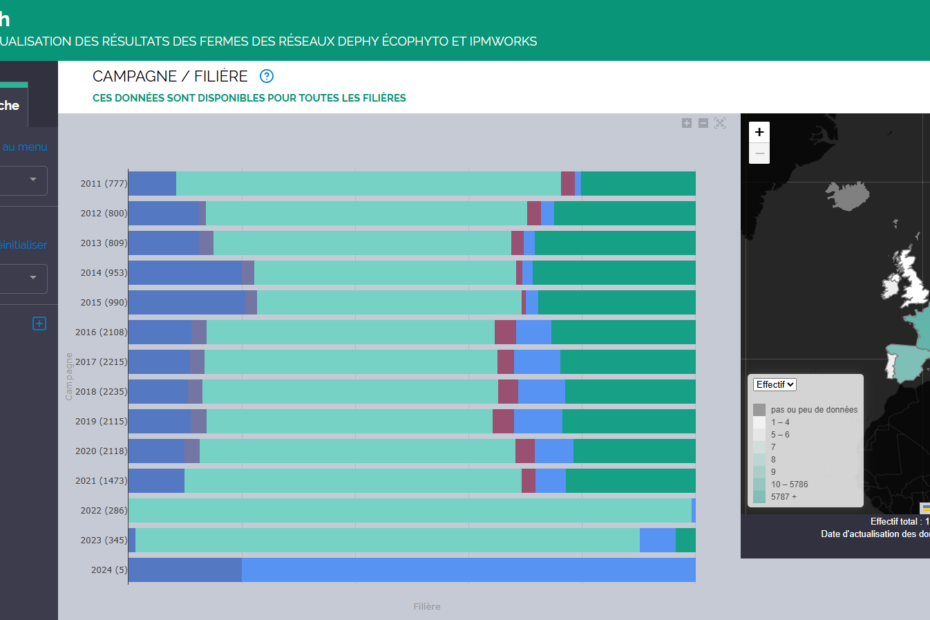
IPMgraph is now available. IPMgraph provides an interactive graphical access to quantitative results from the IPMWORKS network of demo farms. Select the variables you are interested in, adapt filters to select subsamples of farms (e.g. one given sector), and click on the blue button to display graphs, maps and tables. Data were collected through IPMWORKS survey #2, using the AGROSYST system. The interface was developed in French, but you can use the translation facility of your browser to have it in your preferred language.
Visit IPMgraph here.